
How to combine data from several apps into one report
By Joseph Gomez Salazar · Paper StPublished Drafted with AI from the public sources listed below. Published by Joseph Gomez Salazar. How we make these guides
Give every app its own raw tab, map names to one spelling, and build one summary tab from those tabs. Before you build, write down what each number means in each app. The same word, like "sales", often means different things. Then check every total against the app itself, each week.
You'll be able to map every number, build the report in any spreadsheet, and catch a wrong total before you act on it.
- You'll get
- a number map to copy, a summary formula, and a 5-line weekly check.
- Expect
- about 6 minutes to read, 20 minutes to map, and about 1 hour to build.
- For
- owners with numbers in 2 to 5 apps who want one weekly report. Not for: teams that already run a data tool.
- Do you copy numbers from more than one app each week?
- Could you say what "sales" means in each of your apps?
- Did your totals ever disagree with an app's own screen?
First 2 yes, last one no? Skip to "Phase 3: keep it true". Any other mix? Start with Phase 1.
Phase 1: decide what the report answers
Phase 1 of 3 · today · 20 minutes
-
Write the 3 to 5 questions the report must answer.
Each question names a number and a time span.
Example"What did each shop sell last week?"
Done whenyou have 5 questions or fewer on one page.
-
Map every number to one app, one report and one meaning.
Open each app and read how it defines the number.
Example"Sales: store app, sales by location report, before tax, after refunds."
Done whenevery row of the number map below is full.
-
Pick one spelling for every shared name.
Shops, staff and products are the usual culprits.
Examplethe store app says "Main St", the booking app says "Main Street". Pick "Main Street".
Done whena list of every name, one spelling each.
The number map to copy. One row per number in the report.
| Number | App | Report or export | What it includes | Time zone |
|---|---|---|---|---|
| Sales | Before or after tax? Refunds? | |||
| Bookings or jobs | Cancelled ones? | |||
| Ad spend | Which accounts? | |||
| [your number] |
Phase 2: build it once
Phase 2 of 3 · this week · about 1 hour
-
Give each app its own raw tab, and never edit the pasted cells.
Paste the export as it comes. A raw tab you edit by hand can no longer be checked against the app.
Exampletabs named Store, Bookings and Ads.
Done wheneach raw tab matches its export row for row.
-
Add a Names tab that turns each app's spelling into yours.
Two columns: the app's name, then your name. Next to each raw tab's pasted columns, add a Shop column that looks up your spelling: =XLOOKUP(B2, Names!A:A, Names!B:B).
Example"Main St" becomes "Main Street".
Done whenevery name in every raw tab has a row.
-
Build one Summary tab from the raw tabs with SUMIFS.
It adds up the rows that match a week and a shop (Google).
Example=SUMIFS(Store!C:C, Store!E:E, A2, Store!A:A, ">="&B1, Store!A:A, "<"&B1+7). Column E is the Shop column from step 5. B1 holds the week's first day.
Done wheneach question from step 1 has a cell.
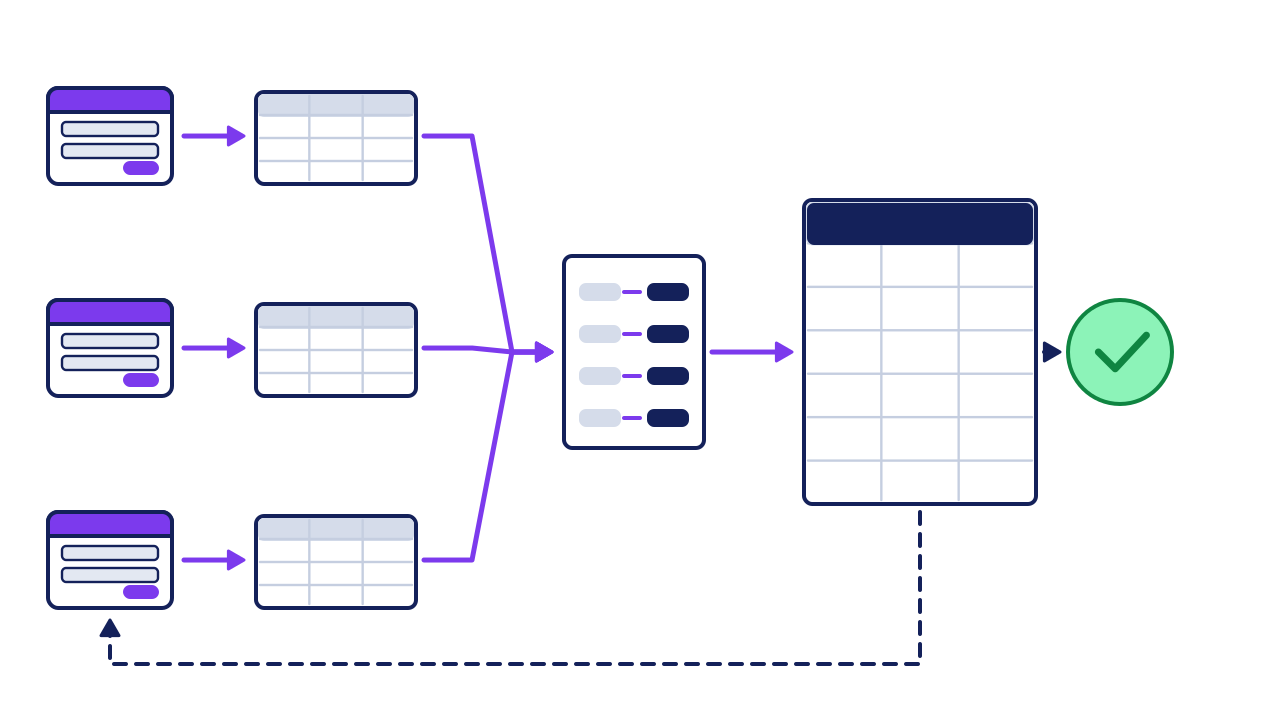
- Raw tabs: one per app, pasted as it comes.
- Name map: each app's spelling turned into yours.
- Summary: one tab, built only from the raw tabs.
- The check: each total tied back to the app's own screen, every week.
Phase 3: keep it true
Phase 3 of 3 · every week · 15 minutes
-
Tie every total back to the app before you read the report.
Compare the raw tab's total with the app's own screen for the same dates. A gap means a meaning or date problem.
Examplethe raw tab says $14,580. The app's before-tax screen says $13,500. The gap is sales tax.
Done whenevery total matches, or its gap is explained.
-
Pull data in, when your tools allow it.
In Google Sheets, IMPORTRANGE pulls a range from another sheet. It limits each pull to 10 MB (Google). In Excel, Power Query's append stacks tables by column name, not position (Microsoft).
Examplethe Store tab pulls from the sheet the store app exports to.
Done whena new export shows up in its raw tab without a paste.
Worked example: 2 shops, 3 apps, 1 wrong total
A shop with 2 locations wants one weekly report. It uses a store app, a booking app for classes, and an ad account.
| Week of 7 Sept | Main Street | Harbor |
|---|---|---|
| Sales, before tax | $8,400 | $5,100 |
| Class bookings | 36 | 12 |
| Ad spend | $300 | $300 |
| Ad spend per booking | $8.33 | $25.00 |
The tie-out caught a wrong total. The first build showed $14,580 in sales. The store app said $13,500 before tax. The export had tax in it: 8% of $13,500 is $1,080.
The fix: the number map now says "before tax", and the Store tab uses the before-tax column.
What they learned: Harbor's ads cost 3 times as much per booking. That is worth a look before next month's spend.
Your turn: this week's report
| Question | App | Raw total | App's own total | Match? |
|---|---|---|---|---|
If it goes wrong
Common mistakes, and the fix for each.
-
The same word means 2 things.
Spot ita total that is off by a steady share, like a tax rate.
Fix itadd the meaning to the number map (step 2).
-
Dates land in the wrong week.
Spot itlate-night sales show up a day off.
Fix itset the sheet's time zone under File, then Settings (Google). Note each app's zone in the map.
-
One sale is counted twice.
Spot it2 apps both report online orders.
Fix iteach number comes from one app only.
-
A new name breaks a total.
Spot ita new shop or staff member reads 0.
Fix itadd the name to the Names tab.
Check your work
Do-confirm checklist. Do the work, then confirm each line.
Answer from memory, then open the answers.
What do you write down before you build anything?
Show the answer
The number map: app, report and meaning for every number.
What does a gap between your total and the app's mean?
Show the answer
A meaning or date problem. Find it before you act.
When a tool is the better answer
- You copy every day, not every week. A daily report by hand costs more than a connector.
- More than about 5 apps or 10 shops. The Names tab gets hard to keep. That line is our view.
- Someone must see it live. A weekly sheet is a look back, not a live screen.
Your next step
fill in the number map today. It takes 20 minutes. Then build the raw tabs and the Summary tab before Friday, and do your first tie-out.
Go deeper: why checking by eye is not enough
Show the detail
People are poor at finding errors by looking. In lab tests, 51% of small spreadsheets had errors (Panko, 2000). People checking a spreadsheet cell by cell, alone, caught only about half of all errors (Panko, 2000). A tie-out turns checking into a comparison of 2 totals, which is easier.
Why raw tabs stay raw. When a raw tab matches the export, a wrong total can only come from the map, the names or the formula. That makes the fault quick to find.
Read next
Sources
- Google, "SUMIFS function," Docs Editors Help. support.google.com/docs/answer/3238496?hl=en
- Google, "IMPORTRANGE," Docs Editors Help. support.google.com/docs/answer/3093340?hl=en
- Google, "Set a spreadsheet's location and calculation settings," Docs Editors Help. support.google.com/docs/answer/58515?hl=en&co=GENIE.Platform%3DDesktop
- Microsoft, "Append queries (Power Query)." support.microsoft.com/en-us/excel/append-queries-power-query
- Panko, "Spreadsheet Errors: What We Know. What We Think We Can Do," EuSpRIG symposium, 2000. arxiv.org/abs/0802.3457
About this guide
- How it was made
- drafted with AI from the 5 public sources above. No Paper St client notes were used.
- How it was checked
- each number against its source, by a checker separate from the drafter, before release.
- Who published it
- Joseph Gomez Salazar. Published Oct 11, 2026. Last updated: not yet.